

-
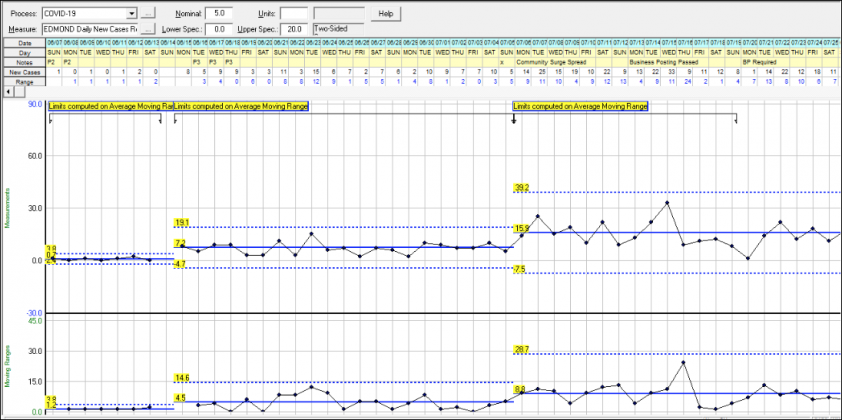 Edmond Daily New Cases reported from June 7th to July 25th. Source: Pinnacle Partners West LLC.
 -
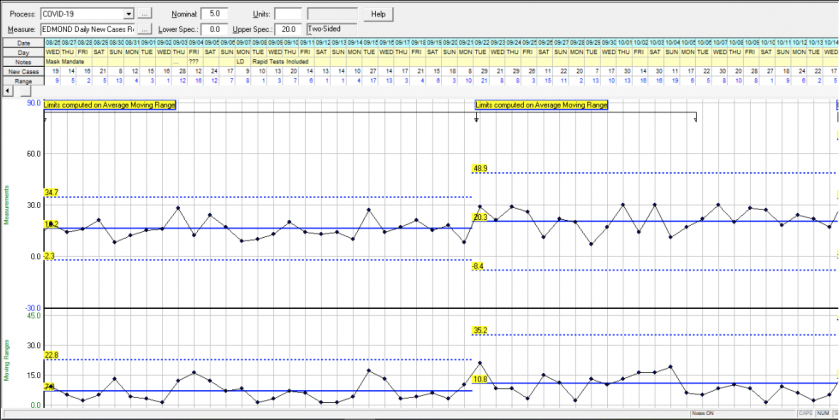 August 26th - October 14th
 -
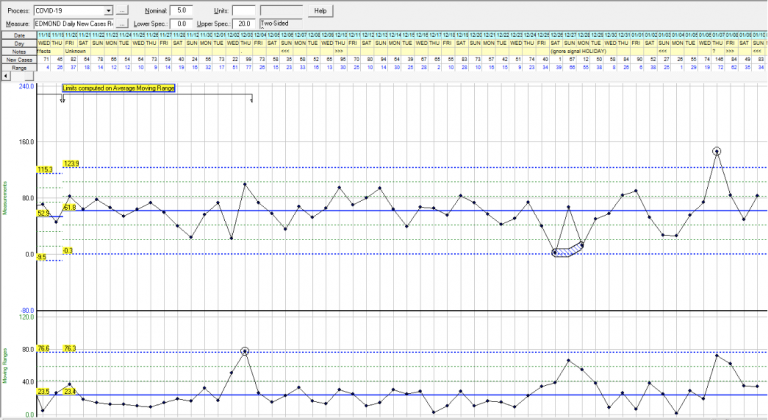 November 18th - January 10th
Edmond’s COVID-19 Journey
On October 21st the Oklahoma State Health Department (OSHD) reported that there have been 3,479 cases of COVID-19 in Edmond. When reviewing the numbers from the City’s Emergency Management Office, there had only been 2,040. That’s a difference of 1,439 or 41.4% fewer than the health department is reporting. Why?
To understand the why, an understanding of the counting methodologies must be obtained. First and foremost, Matt Stillwell, the City’s Emergency Management Director, only counts cases where the patient actually resides inside the city limits. Unfortunately, the OSHD reports city numbers based on zip codes. The flaw in this method lies in the fact that the zip codes labeled “Edmond” encompass much more than just the city limits.
Less than 10% of the geographic area of 73012, 73025 and 73049 are inside the City of Edmond. Less than 35% of 73013 is inside the city limits. And while more than 60% of zip codes 73007 and 73034 are inside the city limits, only 73013 is entirely inside the City of Edmond. Confusing? Yes, but one must remember that this virus does not stop at the city limits or even at the zip code boundaries.
However, it is important for everyone, and especially Edmond business owners, to understand what is happening around them in regards to COVID-19. A statistical analysis of the Edmond cases since June 7th, the first day Edmond received Edmond-specific data, reveals the journey Edmond has been on fighting this pandemic. And even more important is understanding that the Edmond-specific data does not show how many cases there are, or have been, in Edmond. What a statistical analysis of this data does show is how well (or poorly) the general public is following both public and private sector policies that have been implemented to combat the disease.
From June 6th to the 14th, an average of 0.7 new cases per day was reported for Edmond proper. This average jumped to 7.2 per day for the period June 15th to July 5th, and then the average increased again to 15.9 through August 1st.
During the timeframe of August 2nd to August 25th it appeared that the City Council’s mask ordinance requiring businesses to post their policies, in conjunction with the big box stores mandatory policies, was working to reduce the spread of COVID-19 in Edmond. The average number of new cases reported daily dropped from 15.9 to 10.7.
But then the University of Central Oklahoma and the Edmond Public Schools came back into session. It appeared that UCO’s approach to managing the spread of the virus, which was vastly different than OU and OSU’s approach, was working until UCO became a Hotspot. The City saw an increase from 10.7 to 16.2 during the first five weeks of classes at UCO. Then the City’s daily average jumped to 20.3 beginning September 22nd. Of this 20.3 per day, 8.5 per day were attributed to UCO students and faculty up until October 10th when the university appeared to get the uptick under control and their daily average dropped to 1.6 per day.
The problem facing city leaders is that the overall average for Edmond proper remained at 20.3 per day after UCO’s numbers dropped. And another statistical increase in this average has been identified from October 15th to the 29th; possibly as a result of the outbreak at the Purina Plant just south of the city limits.
The numbers presented within this analysis and explanation are not trying to identify and total all COVID-19 cases in Edmond. The technique used to interpret the City’s data, as well as the State’s data, looks at how well the general population follows the public and private policy decisions, and to determine if these decisions are making a difference.
Armed with this type of analysis, city leaders as well as business owners, can begin to see how their policy decisions are both impacting the spread of the virus and the way the general public responds to those decisions. As a whole, Edmond’s citizens appear to have been very responsive to the City Council’s “business posting policy” and the big box stores’ policies requiring masks. However, since the start of classes at both UCO and EPS, it has not been possible to determine how effective the City’s mandatory mask policy has been to-date. And complicating this analysis is the school district’s reporting method of only showing weekly active cases.
Through October 29th Edmond is experiencing a statistical average of 33.8 new cases per day. How our city leaders, business owners, and the general population respond to this latest increase will determine how effective our battle against this virus will be in the long run.
UPDATE Nov. 23, 2020: After we completed writing this opinion piece on October 29th, a statistical signal showed a decrease in daily new cases for Edmond. Unfortunately, the drop from 33.8 new cases per day to 28.2 per day was short-lived. After a two week period averaging 28.2 new cases daily, Edmond just like much of the country, saw the effects of early voting, Halloween and Election Day. Standing in long lines, and attending Halloween parties and allowing children to participate in handout night appears to have started a new round of community spread.
Correlating strongly to these events, the average number of new cases (through statistical signals) has now increased to 52.9 new cases per day; an 87.6% increase in daily new cases. What this means is we may be in for a long and recovery with two of the biggest holidays of the year right in front of us. To slow down this surge, each of us needs to be vigilant: Wear your mask, wash your hands frequently, and practice social distancing.
UPDATE Jan. 11, 2021: Our last update set the average for new cases daily at 52.9. However, Election Day by itself resulted in a surge from 52.9 to 61.8 new cases per day for residents within the city limits of Edmond. The concern moving forward across the state was if Election Day created a surge, what would the holidays bring? What has been interesting in observing and analyzing the data since the beginning of November is that while it was widely reported that a surge associated with Thanksgiving had occurred in Oklahoma, statistically no such surge occurred. What did occur statewide, just as in Edmond was a surge associated with Election Day.
Since the Election Day surge, Edmond did not see any statistical signals suggesting a change in the number of daily new cases until December 26th. But, this signal was due to a lack of results being reporting over the Christmas weekend. Another signal occurred for daily new cases, which was a record 146, which reported on January 7th. This signal occurred during the window where a surge caused by Christmas gatherings would be expected. But what we did not expect was that this was a single-day event and the numbers have dropped back within the statistical limits.
A window associated with New Year’s celebrations opened on January 10th. While there has not been a statistical signal produced yet, this will be watched over the next week to see if Edmond citizens followed social distancing policies or gathered to celebrate the end of 2020. As we roll into the vaccination phase of this pandemic, please remember to wear your mask and social distance; even if you have received your first vaccination shot since it takes two weeks after the second dose to build immunity.